Winter Chill 2026 - How are we tracking?
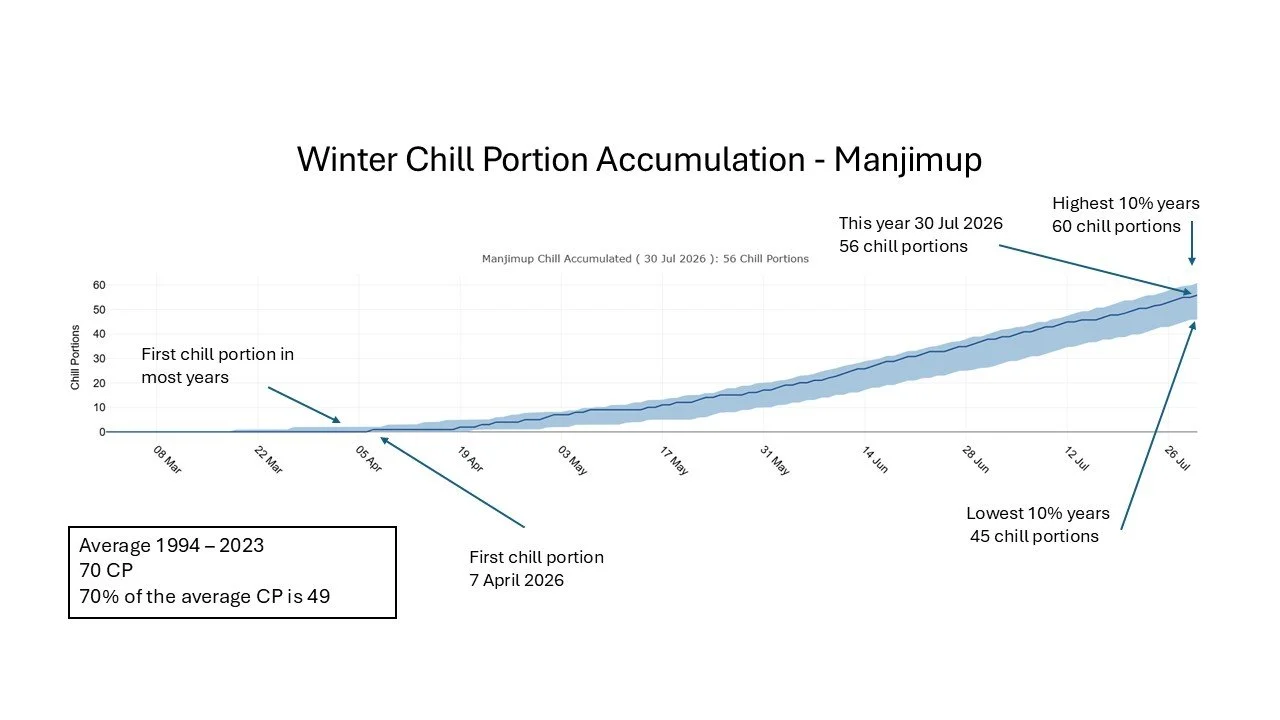
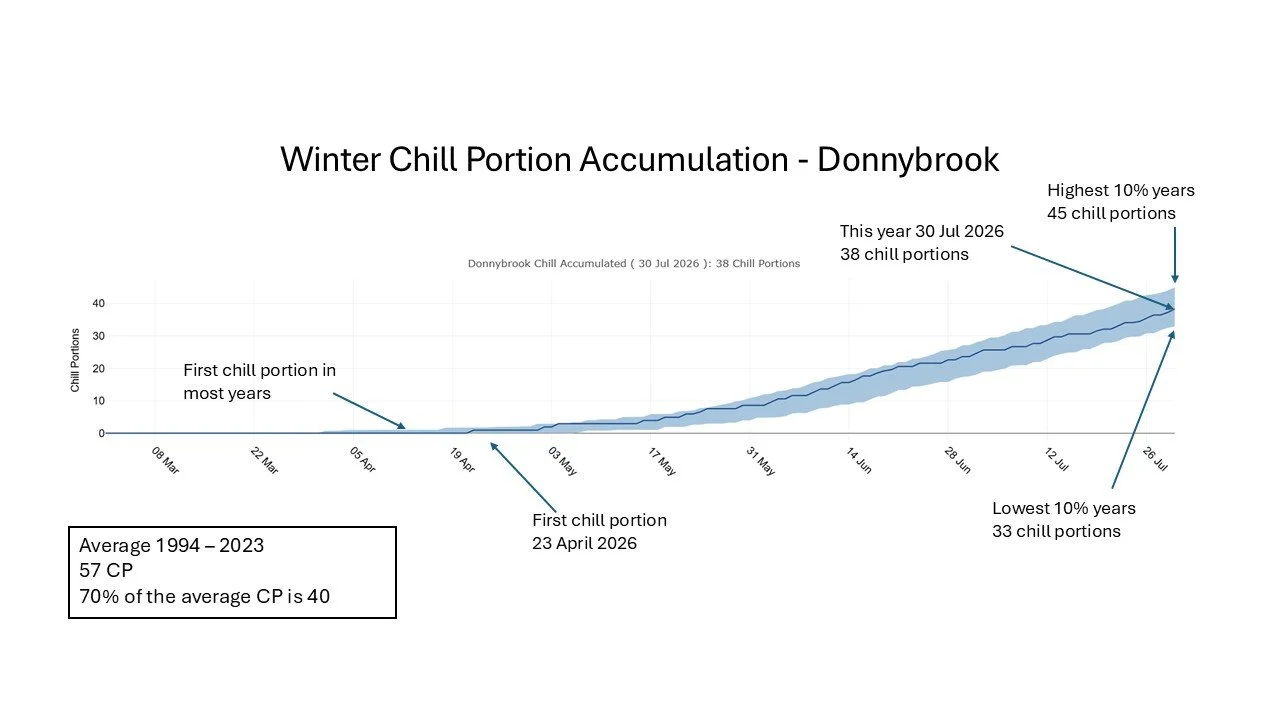
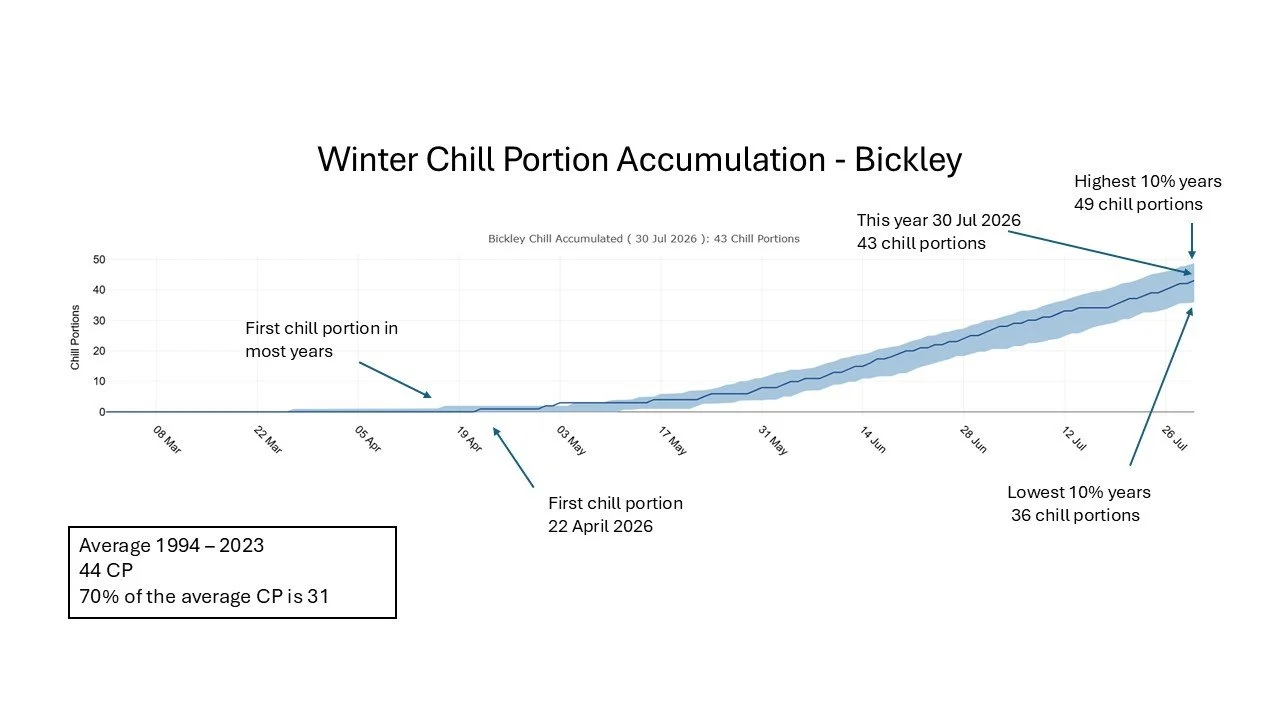
The 2026 winter chill portion accumulation has been tracking along in the top 10% of years for most of winter, it’s just starting to drop away now. But for most locations we have reached the 70% of the average winter chill portions required to break dormancy.
With the cool morning setting in early meant that winter chill started accumulating in April. The first chill portions for Bickley and Donnybrook were recorded in mid-April, with Manjimup slightly earlier in the first week of April, this is a month ahead of when chill accumulation started last year.
As we have experienced a cool winter for 2026, it has meant that winter rainfall in tracking along below average with July recording only a third of the expected rainfall.
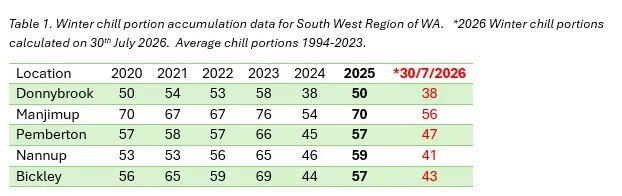
When timing dormancy breaking applications it is good practice to look at the winter chill accumulation for past years to predict what might happen in the current season. If you check your records, 2022 was also a year where winter accumulation started early and tracked along in the top 10% of years. Further investigation of previous high chill years can be done using the My Climate View resource My Climate View developed by the Climate Services for Agriculture program funded by the Australian Government’s Future Drought Fund (FDF). As shown in the past and projected winter chill accumulation graph in figure 1, the chill accumulation is set to decline in the future.
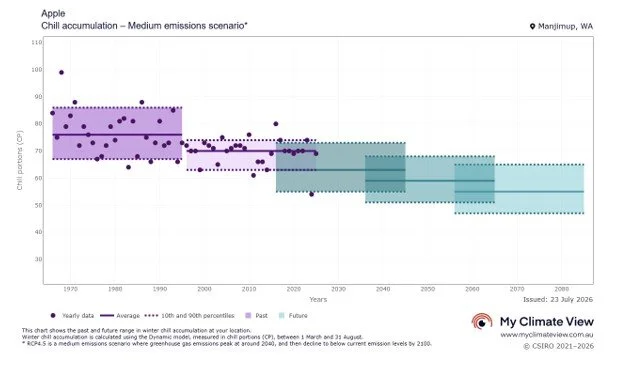
Figure 1. Past and projected future chill accumulations for Manjimup, My Climate View.
Dynamic chill model (Erez et al. 1990) is the current best practice model, especially in warmer climates. It calculates chill in Chill Portions, based on hourly temperatures between 2oC and 14oC. The Dynamic model has many features that capture known temperature-winter chill relationships that are lacking in other models including the Chill Hours model. In the graphs below the shaded area represents the highest 10% of years through to the lowest 10% of year. Solid blue line is this year’s winter chill accumulation. The follow the link below to calculate todays winter chill accumulation, for your location using the bureau of meteorology weather stations. Tech types and tools | AgTech